NVitop is a powerful terminal-based utility designed to provide real-time monitoring of NVIDIA GPUs, delivering instant insights into usage, memory, temperature, and power consumption. In high-performance computing, AI development, and gaming, understanding GPU performance at any given moment is crucial for optimizing workloads, preventing overheating, and maximizing efficiency.
By leveraging NVIDIA’s Management Library (NVML) and optimized polling loops, NVitop continuously refreshes GPU statistics with minimal overhead. Its lightweight, multi-GPU support and customizable display make it an indispensable tool for developers, system administrators, and enthusiasts who need precise, up-to-the-second data without the resource demands of graphical monitoring tools.
A Brief Overview of NVitop
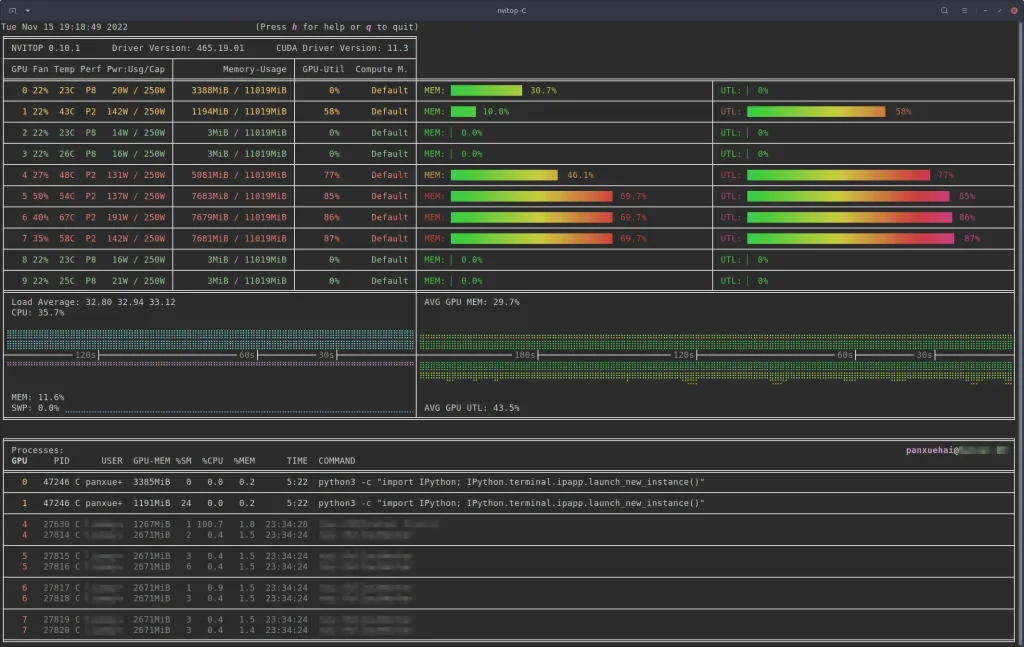
Nvitop is a terminal-based utility designed specifically for NVIDIA GPUs. Its purpose is to provide a live snapshot of GPU performance, akin to a “top” command for CPUs but tailored for graphical processors. Unlike static benchmarking tools, NVitop continuously polls the GPU to refresh its statistics, offering developers and system administrators an up-to-the-second view of resource usage.
Key Features of NVitop
- Real-Time Monitoring: Displays GPU metrics instantly, including core usage, memory utilization, temperature, and fan speed.
- Terminal-Based Interface: Lightweight, doesn’t require a GUI, making it ideal for remote servers.
- Multiple GPU Support: Can track several GPUs simultaneously, which is essential for machine learning clusters.
- Customizable Refresh Rate: Users can set intervals for updates, balancing system load and responsiveness.
NVitop’s appeal lies in its simplicity and efficiency, especially for professionals who need immediate feedback about GPU load without heavy overhead.
How Real-Time GPU Monitoring Works
Before diving into NVitop’s mechanisms, it’s important to understand the broader concept of real-time GPU monitoring. At its core, real-time monitoring involves three main steps:
- Data Acquisition: Gathering raw metrics from the GPU hardware.
- Data Processing: Interpreting these metrics into readable statistics.
- Display Update: Refreshing the visual output to reflect the latest metrics.
These steps must be executed in rapid succession to provide a smooth, lag-free experience. NVitop achieves this by leveraging NVIDIA’s proprietary libraries and carefully optimized polling techniques.
The Role of NVIDIA Management Library (NVML)
NVitop relies heavily on the NVIDIA Management Library (NVML), which is an API provided by NVIDIA to query GPU hardware metrics. NVML exposes a rich set of functions that allow applications to monitor:
- GPU utilization (percentage of time the GPU is active)
- Memory usage (allocated and free memory)
- Temperature readings
- Power consumption
- Clock speeds
- Fan speeds
How NVML Enables Real-Time Updates
NVitop calls NVML functions at regular intervals to fetch the latest GPU metrics. This polling is performed asynchronously, meaning the tool requests data without blocking other processes, which is crucial for maintaining real-time performance. Essentially, NVML acts as a bridge between the GPU hardware and NVitop’s terminal interface.
Refresh Mechanism in NVitop
So, specifically, how does NVitop refresh GPU statistics in real time? The process can be broken down into several technical layers:
Polling Loop Architecture
NVitop operates on a continuous polling loop:
Initiate Polling Cycle
NVitop initializes NVML and identifies all connected GPUs. It prepares data structures to store metrics for each GPU.
Fetch Metrics
For each GPU, NVitop requests current usage statistics using NVML API calls. This includes memory consumption, GPU load, power draw, and temperature.
Process and Format Data
Raw metrics are converted into human-readable formats, such as percentages, gigabytes, or degrees Celsius. Data can also be color-coded for easier interpretation.
Update Terminal Display
The terminal is cleared and repopulated with the latest statistics. This is done using efficient buffer manipulation to prevent flickering and reduce CPU overhead.
Repeat
The loop continues at the user-defined refresh rate (default is often 1 second), giving the illusion of “real-time” updates.
Asynchronous Polling and Thread Management
To ensure the main thread isn’t blocked, NVitop often uses multi-threading:
- One thread handles fetching GPU data.
- Another thread manages terminal output.
- Optional threads can handle logging or alerts.
This separation ensures that large data requests or slow GPUs don’t cause delays in the display update.
Optimizing Refresh Rates
The refresh rate determines how frequently NVitop updates GPU statistics. While faster rates provide more immediate feedback, they can also increase CPU usage and NVML API calls, potentially impacting overall system performance. NVitop allows users to configure refresh intervals, typically in milliseconds or seconds, striking a balance between performance and responsiveness.
Factors Influencing Refresh Rate
- Number of GPUs: More GPUs mean more data to fetch and process.
- System Load: High CPU load can delay updates.
- Network Latency: For remote monitoring, network speed can affect perceived real-time updates.
- Polling Overhead: Each NVML call consumes CPU cycles; optimizing the number of calls reduces lag.
By fine-tuning refresh intervals, users can maximize both accuracy and efficiency.
Terminal-Based Visualization Techniques
NVitop’s terminal output isn’t just raw numbers—it’s designed to be intuitive and actionable. Several techniques are used:
- Color Coding: High GPU utilization or temperature can be highlighted in red.
- Bar Graphs: Simple ASCII bars represent memory or GPU usage.
- Sorting Options: GPUs can be displayed by utilization, temperature, or memory usage.
Benefits of Terminal-Based Output
- Minimal resource overhead compared to GUI tools.
- Works over SSH or remote connections without graphical interface.
- Ideal for servers running multiple GPUs where desktop environments aren’t available.
Advanced Features Enhancing Real-Time Monitoring
NVitop offers several advanced capabilities that improve its usability for professionals:
- Process-Level Tracking: Identifies which processes are consuming GPU resources, including memory and compute time.
- Historical Logging: Captures snapshots over time for analysis without relying on third-party tools.
- Custom Alerts: Users can define thresholds for temperature, utilization, or power, triggering notifications in real time.
- Multiple Layout Options: Adjusts how GPU stats are displayed, such as vertical vs. horizontal alignment, or grouping by type.
These features turn NVitop from a simple monitor into a powerful diagnostic tool.
Points on Performance Considerations
- NVitop’s CPU overhead is generally low, but extremely frequent polling (e.g., 100ms intervals) can impact performance on systems with limited resources.
- On multi-GPU setups, NVitop optimizes polling by batching NVML requests where possible, reducing API call overhead.
NVitop vs Other Monitoring Tools
NVitop’s real-time refresh capabilities distinguish it from other GPU monitoring solutions like:
- nvidia-smi: Provides similar metrics but lacks a dynamic, continuous display.
- GUI Tools (e.g., GPU-Z, MSI Afterburner): Resource-intensive and not ideal for servers or remote monitoring.
- Custom Scripts: Require manual coding and lack NVitop’s optimized polling and display efficiency.
By combining low overhead, real-time updates, and flexible display, NVitop fills a niche that balances precision with usability.
Real-World Use Cases
- AI and Machine Learning Training: Monitoring GPU utilization and memory in real time prevents bottlenecks and ensures model training efficiency.
- Game Development: Developers can test graphical performance and detect resource spikes during complex scenes.
- Server Maintenance: Administrators track GPU health, fan speeds, and power usage to prevent hardware failure.
- Overclocking and Optimization: Real-time feedback allows fine-tuning of clock speeds and thermal management.
Points on System Integration
- NVitop can be run in headless server environments, making it compatible with cloud-based GPU instances.
- Can integrate with cron jobs or monitoring scripts to automate GPU health reporting.
- Logs generated by NVitop can feed into data visualization dashboards for long-term analysis.
Troubleshooting Common NVitop Issues
- GPU Not Detected: Ensure NVML drivers are properly installed and the GPU is supported.
- Flickering Display: Adjust terminal settings or refresh rate to reduce flicker.
- High CPU Usage: Lower refresh rate or disable unnecessary metrics.
These minor adjustments maintain optimal real-time performance without compromising monitoring quality.
Conclusion
NVitop stands out as an essential tool for real-time GPU monitoring, offering precise, continuous insights into performance, memory usage, temperature, and power consumption. By efficiently leveraging NVIDIA’s NVML and optimized polling mechanisms, it delivers accurate statistics with minimal system overhead, making it ideal for multi-GPU setups, AI workloads, and high-performance computing environments.
Its terminal-based interface, process-level tracking, and customizable refresh rates empower developers, administrators, and enthusiasts to make data-driven decisions, prevent bottlenecks, and maintain optimal GPU health. With NVitop, real-time GPU monitoring is not just convenient; it becomes a strategic advantage for maximizing performance and ensuring system reliability.