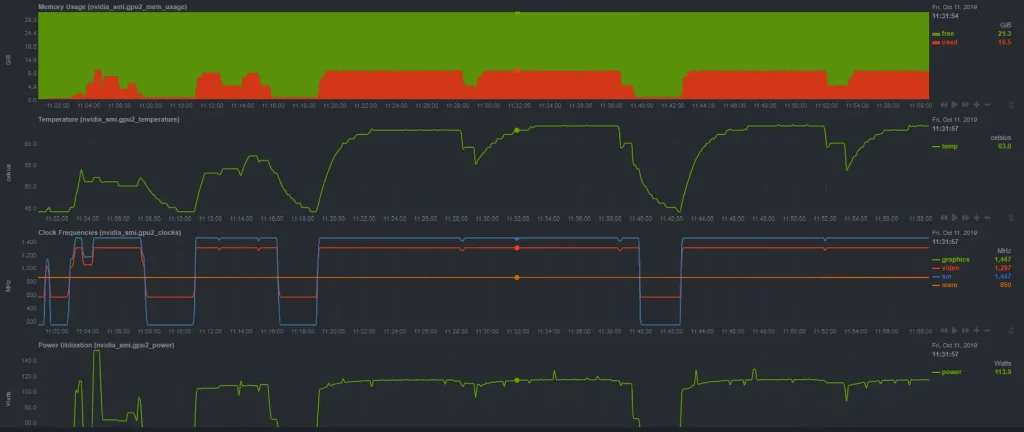
Nvitop is a powerful, terminal-based monitoring tool designed specifically for NVIDIA GPUs, widely used by developers, researchers, and system administrators to observe real-time GPU performance. It provides clear insights into GPU utilization, memory consumption, running processes, and user-level activity, all within a lightweight and interactive interface.
Because it is commonly used on servers and headless systems, many users naturally wonder how well Nvitop fits into remote workflows and whether it can effectively support monitoring GPUs from a distance without sacrificing accuracy or control. Rather than offering surface-level answers, we’ll explore the internals, workflows, and edge cases that matter in real-world environments.
Nvitop at a practical level
Nvitop is a terminal-based GPU monitoring tool designed for NVIDIA hardware. It is often compared to system monitors like top or htop, but its focus is narrow and deliberate: providing a clear, continuously updating view of GPU state, processes, memory usage, and utilization metrics.
At its core, nvitop interfaces with NVIDIA’s management libraries and drivers on the host system. It reads data exposed by the driver stack, interprets it, and renders it in a terminal-friendly dashboard. This design choice is both its strength and its limitation. Because it is lightweight and text-based, it integrates seamlessly into server workflows, SSH sessions, and headless machines. At the same time, it does not attempt to become a network service or monitoring daemon.
Understanding this local-first design is essential before talking about remote usage. nvitop does not “phone home,” broadcast metrics, or open listening ports. It assumes it is running on the same operating system that directly controls the GPU.
What “remote monitoring” actually means
The phrase “remote monitoring” can mean different things depending on who you ask. For some, it means viewing GPU stats from a laptop while the GPU sits in a server rack elsewhere. For others, it means aggregating metrics from many machines into a centralized dashboard. These are very different problems.
Remote access can be loosely divided into two models:
- Interactive remote access, where you log into a machine and run tools as if you were physically there.
- Detached remote observation, where data is pushed or pulled over the network and viewed without logging into the machine directly.
nvitop is firmly aligned with the first model. It excels when you have shell access to a system and want an immediate, accurate view of GPU activity. It does not, by itself, implement the second model.
Running nvitop on a remote machine via SSH
The most common and practical way to use nvitop “remotely” is through a secure shell connection. From the tool’s perspective, nothing is remote. It runs locally on the server, reads local GPU data, and displays it in the terminal session you’re connected to.
This approach works remarkably well for most professional use cases. Once connected, the interface behaves exactly as it would on a local machine. Refresh rates, process lists, memory charts, and utilization percentages remain accurate because they are sourced directly from the driver.
There are a few technical nuances worth understanding. Terminal capabilities matter. A modern terminal emulator with proper color and Unicode support will display nvitop cleanly. Network latency rarely affects the correctness of the data, only the responsiveness of key presses. Because nvitop is text-based, bandwidth usage is negligible.
In practice, this means you can sit on a laptop anywhere in the world, connect to a GPU server, and watch real-time utilization as if you were in the same room.
Why Nvitop does not act as a network monitor
It is tempting to ask why nvitop does not simply include a “remote mode.” The answer lies in its philosophy and scope. nvitop was designed to be a viewer, not a collector. Adding network functionality would introduce complexity, security considerations, and maintenance overhead that run counter to its minimal design.
Network-based monitoring tools must handle authentication, encryption, firewall traversal, and data serialization. They also need a server component that runs continuously. Nvitop avoids all of this by assuming the user already has secure access to the machine through existing tools like SSH.
This choice keeps the tool focused and reliable. When nvitop shows GPU memory usage, it is reading the same values the driver uses internally, without intermediate layers or cached data.
Monitoring GPUs across multiple servers
In environments with more than one GPU machine, the workflow changes slightly. You typically open multiple terminal sessions, each connected to a different server, and run nvitop independently on each. While this is not centralized monitoring, it scales surprisingly well for small to medium setups.
Many engineers use terminal multiplexers to manage this. By splitting panes or windows, you can watch several machines at once. Each instance of nvitop remains isolated, accurate, and responsive.
This approach emphasizes clarity over aggregation. Instead of a single averaged metric, you see exactly what each GPU is doing, which processes are responsible, and how memory is allocated.
Security implications of remote GPU observation
Security is often overlooked in monitoring discussions. nvitop inherits the security model of the access method you use. If you connect via SSH with key-based authentication, your monitoring session is as secure as your SSH configuration.
Because nvitop does not open network ports or expose APIs, it does not increase the attack surface of the machine. There is no background service waiting for connections. This makes it suitable for sensitive environments where minimizing running services is a priority.
User permissions still apply. If a user does not have permission to view certain processes or device files, nvitop will reflect that. This ensures that GPU monitoring respects the system’s existing access controls.
Performance impact on the monitored system
Another common concern is overhead. Monitoring tools can sometimes distort the very metrics they report by consuming resources themselves. nvitop is intentionally lightweight. It queries GPU state at regular intervals, but these queries are inexpensive relative to GPU workloads.
In real-world scenarios, the performance impact is effectively negligible. Training jobs, inference services, and rendering tasks continue unaffected. This makes nvitop suitable for long-running monitoring sessions during critical workloads. Over SSH, the added load is minimal. Text output and key input represent a tiny fraction of system and network capacity.
When nvitop is not enough
Despite its strengths, there are scenarios where nvitop alone is insufficient. Large-scale deployments often require historical data, alerting, and centralized dashboards. nvitop does not store metrics over time or trigger notifications when thresholds are crossed.
In such cases, nvitop serves a complementary role. It is the tool you open when something looks off, and you need immediate, granular insight. It is less useful as a long-term analytics solution. Understanding this boundary prevents frustration. nvitop is not trying to replace monitoring stacks; it is trying to make live GPU state visible and understandable.
Comparing interactive monitoring to metric collection
Interactive tools and metric collectors solve different problems. Interactive monitoring prioritizes immediacy and context. You see not just numbers, but which processes are responsible, how memory is fragmented, and how utilization fluctuates second by second.
Metric collection systems prioritize aggregation and trends. They answer questions like “What was the average GPU utilization last week?” or “Which node is underutilized?”
nvitop sits squarely in the interactive camp. Its remote usability depends on your ability to interact with the remote system directly.
Practical use cases for remote GPU visibility
To ground this discussion, consider a few realistic scenarios where remote monitoring matters:
- A researcher launches a long training job on a lab server and wants to check progress from home.
- A DevOps engineer oversees multiple inference nodes and needs to identify which one is overloaded.
- A shared compute cluster administrator wants to ensure users are not monopolizing GPU memory.
In all of these cases, nvitop accessed through a secure remote shell provides fast, actionable insight without setup overhead.
Limitations imposed by the operating system
Operating system constraints also shape what is possible. nvitop depends on NVIDIA drivers and libraries being installed on the host OS. It does not bypass the OS or talk directly to hardware.
This means you cannot monitor a GPU from a different OS without logging into the one that owns the driver. Dual-boot setups, containerized environments, and virtual machines introduce additional layers that affect visibility. In container scenarios, for example, you may see only the GPUs and processes exposed to that container. This is not a limitation of nvitop per se, but of the isolation model.
Containerized workloads and remote access
Modern GPU workloads often run inside containers. When you connect remotely and run nvitop on the host, you see the host’s view of GPU usage, including containerized processes. This is usually what you want when diagnosing resource contention.
If you run nvitop inside a container, visibility depends on how devices and permissions are configured. Some environments restrict access to GPU metrics to the host for security reasons. Understanding where nvitop runs, host versus container, is crucial for interpreting what you see.
Common misconceptions about remote GPU tools
There are a few recurring misunderstandings worth addressing. One is the idea that a monitoring tool must have a web interface to be “remote.” In reality, remote simply means accessed over a network, and terminal-based tools excel at this.
Another misconception is that remote monitoring requires special configuration. With nvitop, the only requirement is that it be installed on the machine with the GPU and that you can log in.
Finally, some assume that remote equals delayed or approximate data. In interactive sessions, the data is live and precise, limited only by refresh intervals.
Advantages of text-based monitoring over GUIs
Graphical tools have their place, but text-based monitors offer unique benefits in remote contexts. They are fast, scriptable, and resilient to low-bandwidth or high-latency connections.
nvitop’s interface is designed to convey a lot of information in a compact space. Once you learn to read it, you can diagnose issues at a glance. This efficiency becomes especially valuable when you are hopping between machines.
Text-based tools also integrate naturally with automation. You can launch them as part of a workflow without worrying about display servers or graphical forwarding.
Points to consider before relying on nvitop remotely
Before making NVitop your go-to solution, it helps to evaluate a few practical considerations:
- Ensure consistent driver versions across machines to avoid confusing differences in reported metrics.
- Use stable terminal environments to prevent rendering issues.
- Establish clear access policies so only authorized users can view GPU activity.
- Combine interactive monitoring with logs or metrics for long-term insight.
Thinking through these points upfront saves time and avoids misinterpretation later.
Troubleshooting common remote usage issues
Occasionally, users encounter problems when running nvitop over remote connections. These issues are usually not caused by the tool itself.
Terminal size is a frequent culprit. If the window is too small, the interface may appear cluttered or truncated. Resizing the terminal typically resolves this.
Another issue is insufficient permissions. If the user account cannot access GPU device files, the displayed data may be incomplete. Adjusting group membership or permissions fixes this without modifying nvitop.
Finally, mismatched library versions can cause startup errors. Ensuring that the NVIDIA stack is properly installed on the host resolves most cases.
Scaling beyond manual observation
As environments grow, manually opening multiple sessions becomes less practical. This is where nvitop transitions from primary tool to secondary diagnostic aid.
Many teams adopt a layered approach. Automated systems watch for anomalies and alert humans. When an alert fires, an engineer connects to the affected machine and runs nvitop to investigate in detail.
This workflow leverages the strengths of both approaches without forcing nvitop into a role it was not designed to fill.
Points that define nvitop’s role in remote workflows
To summarize its position clearly, nvitop’s remote usefulness is defined by a few key characteristics:
- It is interactive, not passive.
- It runs where the GPU lives, not where you view it.
- It shows live state, not historical trends.
- It depends on existing secure access methods.
Keeping these points in mind helps set realistic expectations and prevents misuse.
The human factor in monitoring
Monitoring is as much about human interpretation as it is about data. Tools like nvitop shine because they present information in a way that aligns with how engineers think. You see processes, users, memory blocks, and utilization in one coherent view.
When accessed remotely, this cognitive advantage remains intact. You are not staring at abstract graphs detached from context. You are seeing exactly what the machine sees.
This alignment reduces errors and speeds up decision-making, especially under pressure.
Future directions and community expectations
While nvitop’s core design is stable, user expectations evolve. Some users hope for optional export features or integration hooks. Others value its simplicity and resist feature creep.
Regardless of future enhancements, the fundamental model is unlikely to change. nvitop will remain a local viewer first and foremost. Remote access will continue to be achieved through established system tools rather than built-in networking. This stability is a feature, not a flaw. It allows users to build reliable workflows around predictable behavior.
Conclusion
Remote visibility into GPU activity is no longer a luxury; it is a necessity for modern compute workflows. nvitop fits neatly into this reality by offering a powerful, lightweight way to observe GPU state from anywhere you can securely log in. While it does not function as a standalone network monitoring service, its effectiveness over remote shells makes it a trusted companion for engineers, researchers, and administrators alike. By understanding what it does and what it intentionally does not do, you can use it confidently, efficiently, and without misplaced expectations.